hurricanes data visualization
Year
2021
Role
Research
Art Direction
Photography
Software
Adobe Illustrator
Adobe Indesign
Adobe Lightroom
challenge
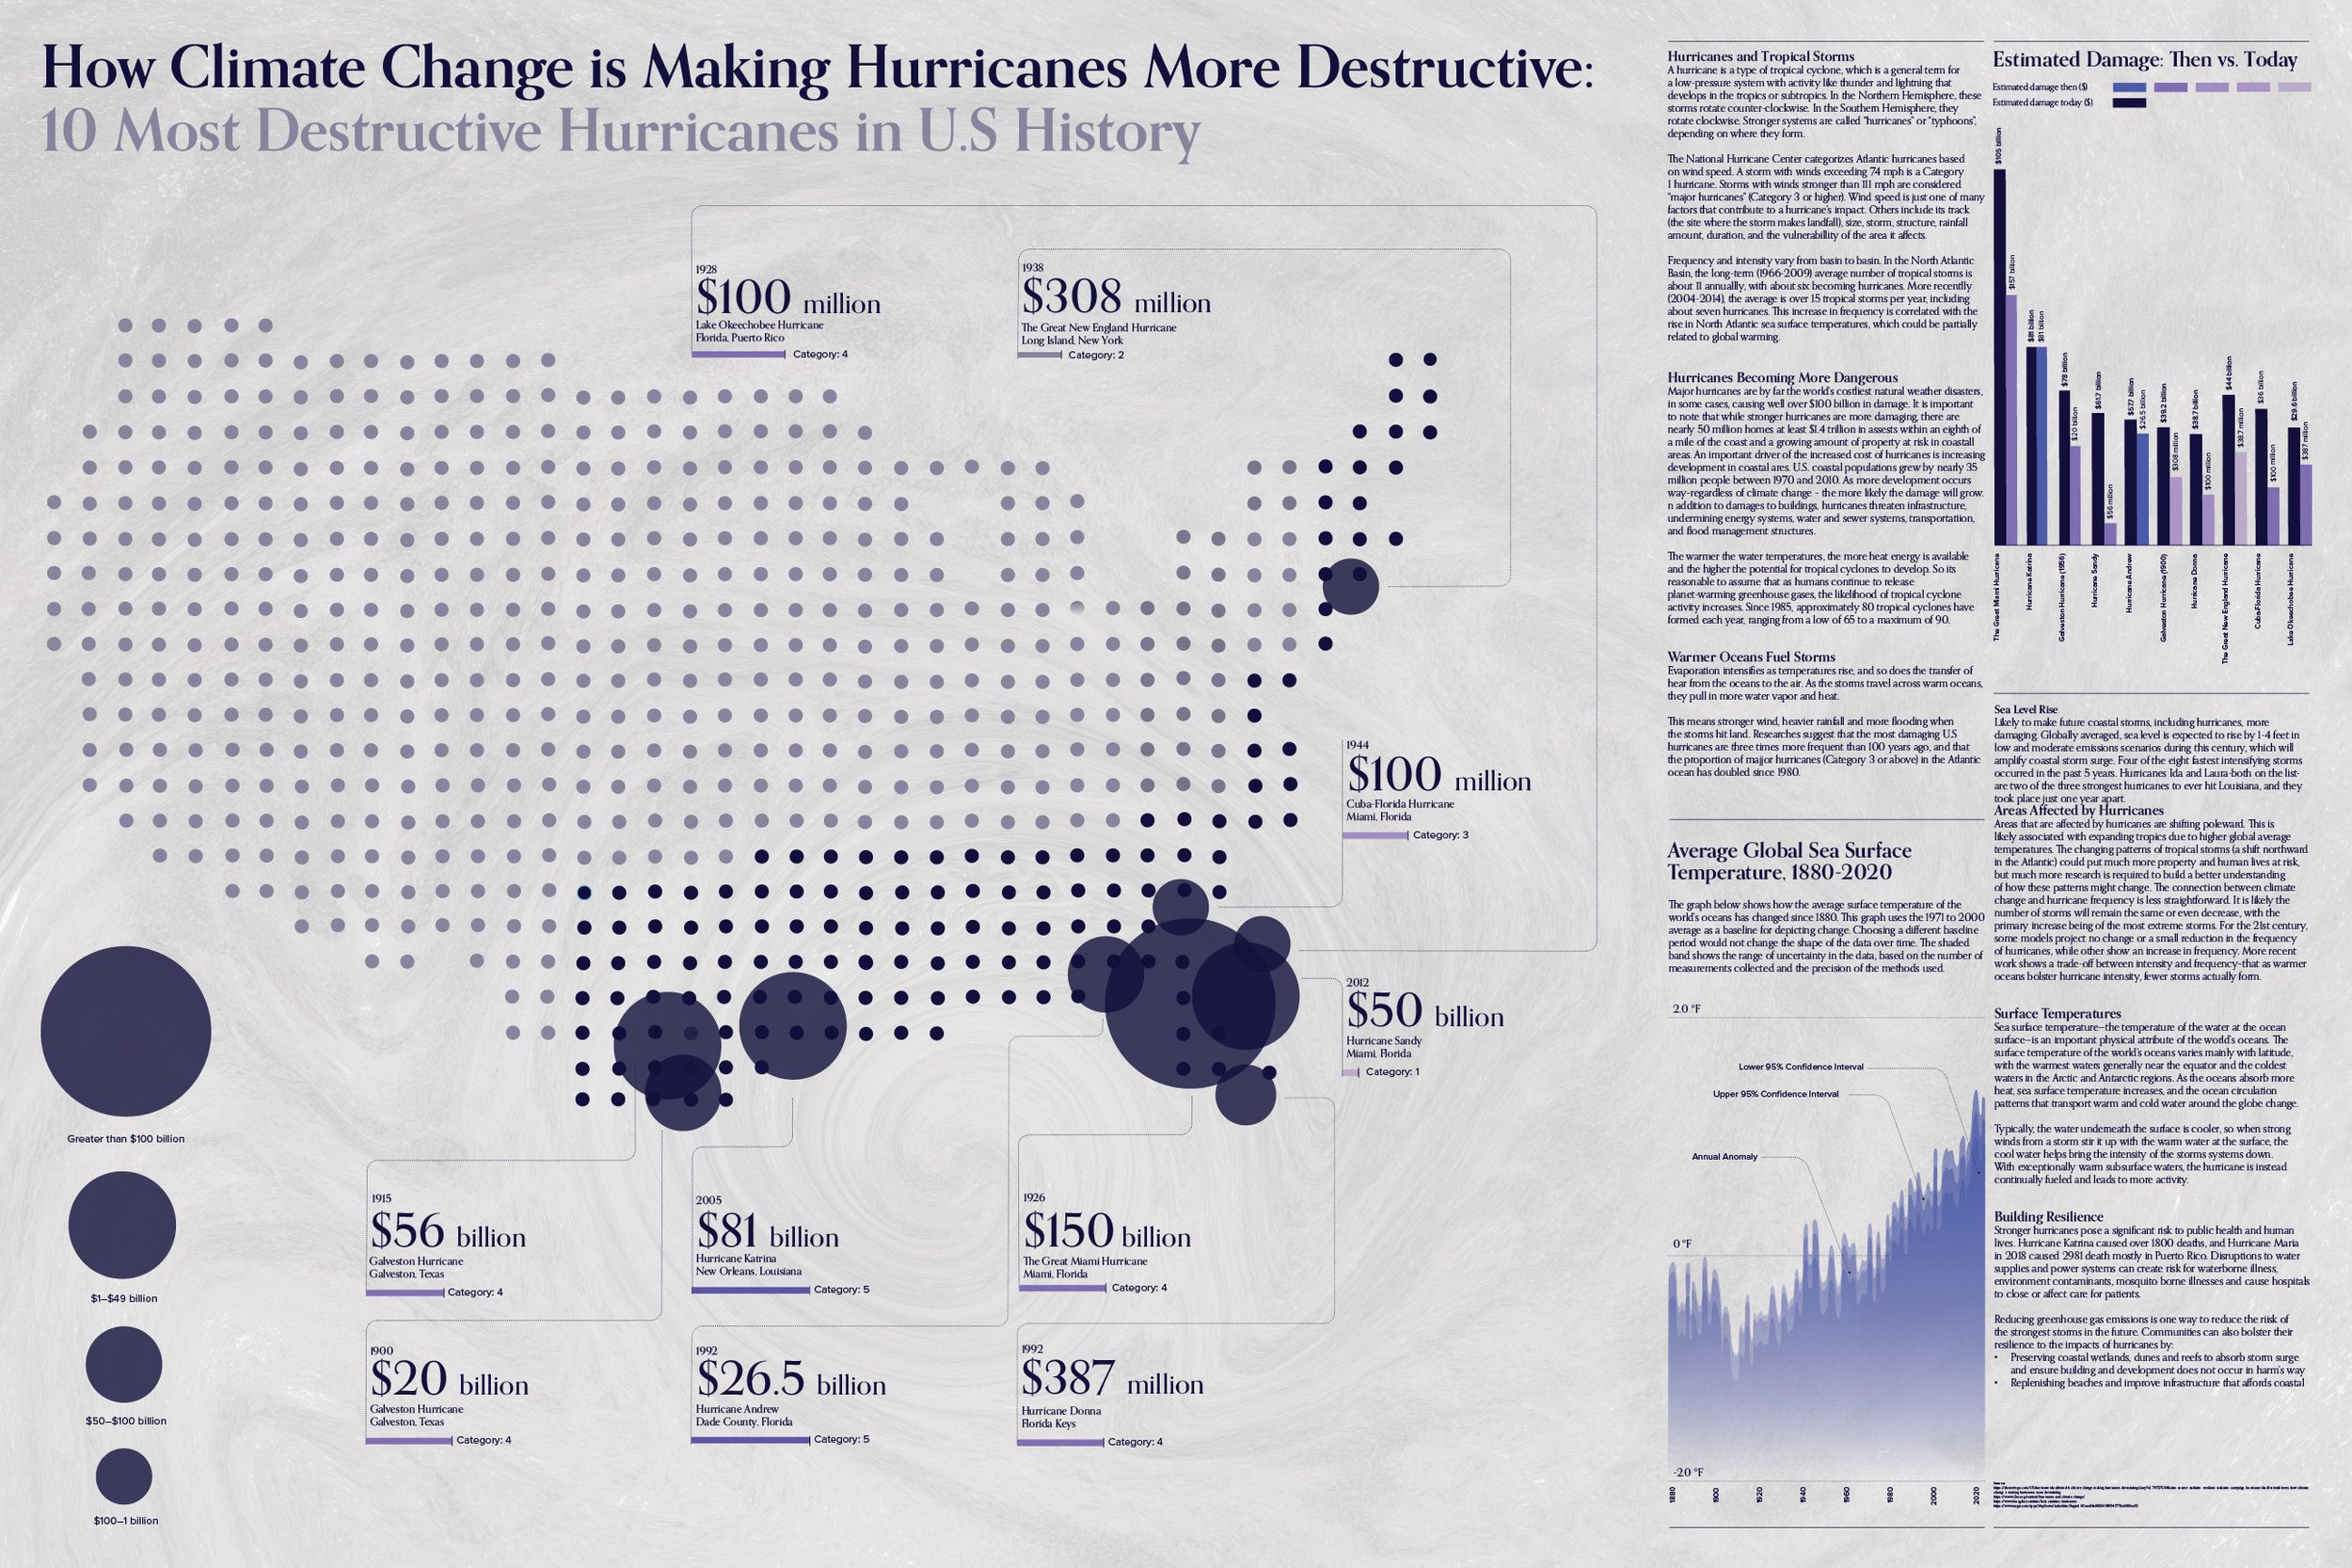
Develop a 2d and 3d infographic design that shows the effect of climate change in making hurricanes more destructive.
outcome
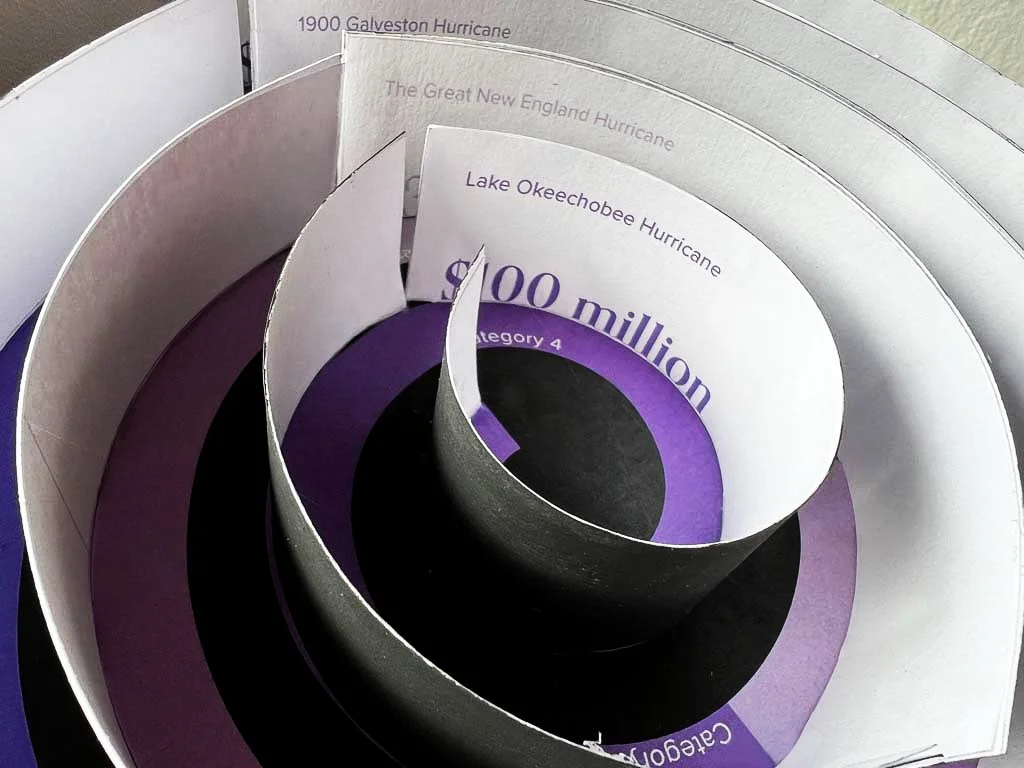
A 2d infographic breaking down the top 10 most destructive hurricanes in u.s history by date, location, category, and estimated loss in money. A 3d form emphasizing the relationship between the estimated cost of damage and the hurricane's category. The spiral starts in the middle and slowly expands reflecting the formation of a hurricane, showing the most destructive hurricanes from lowest to highest.
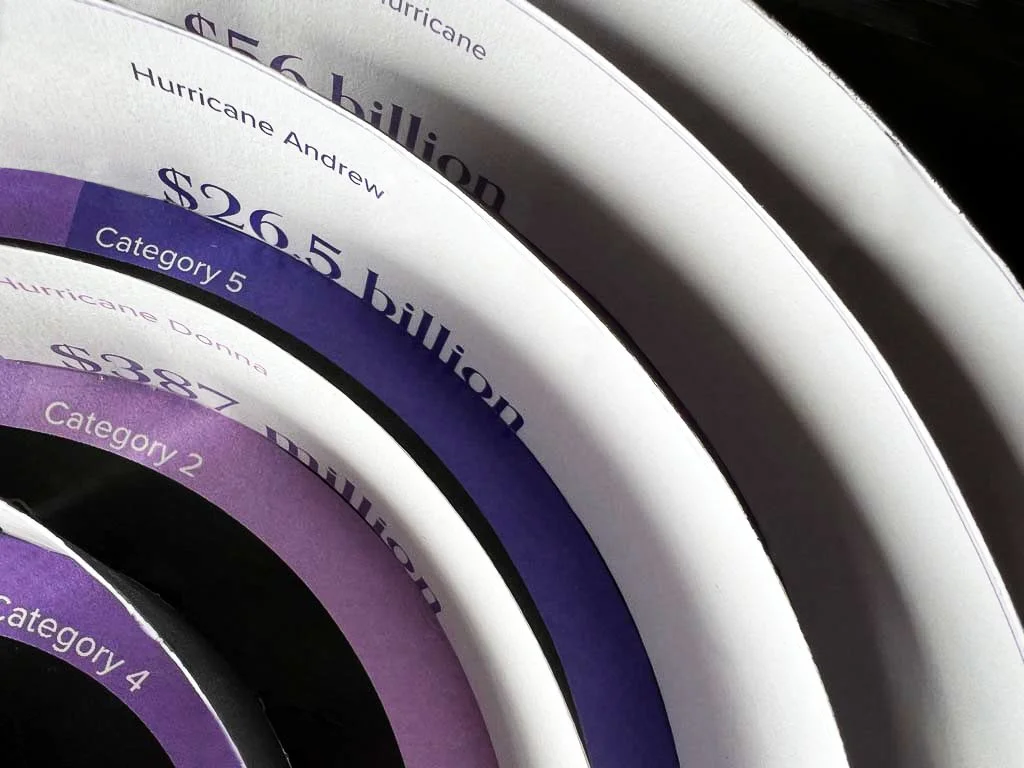
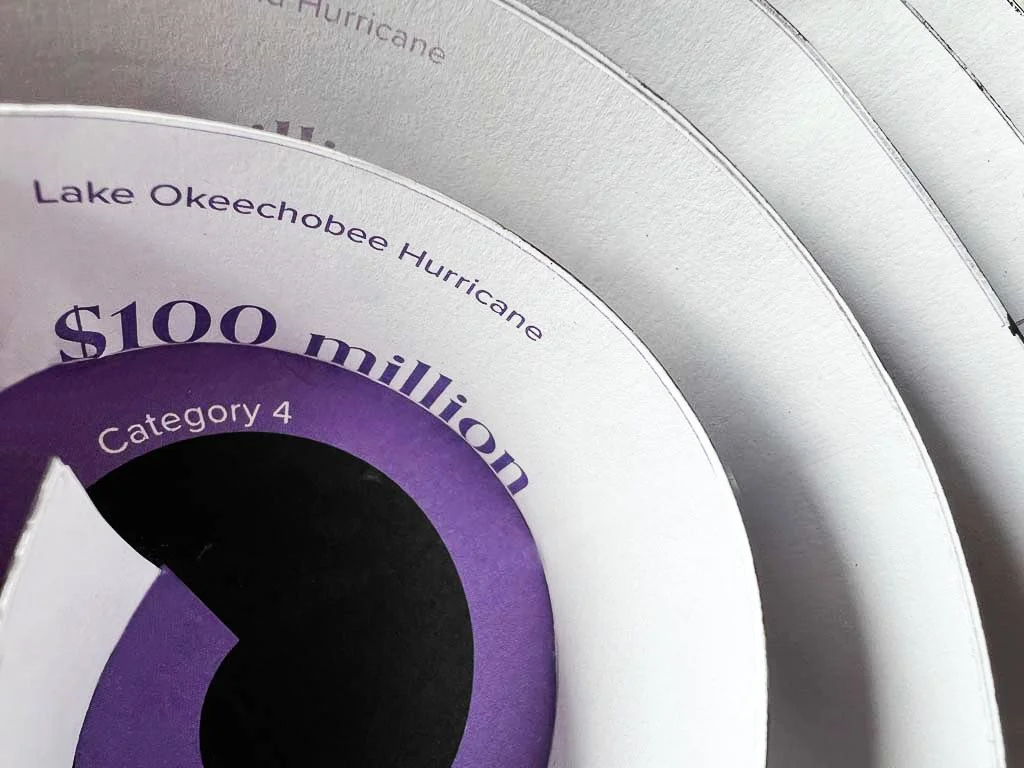
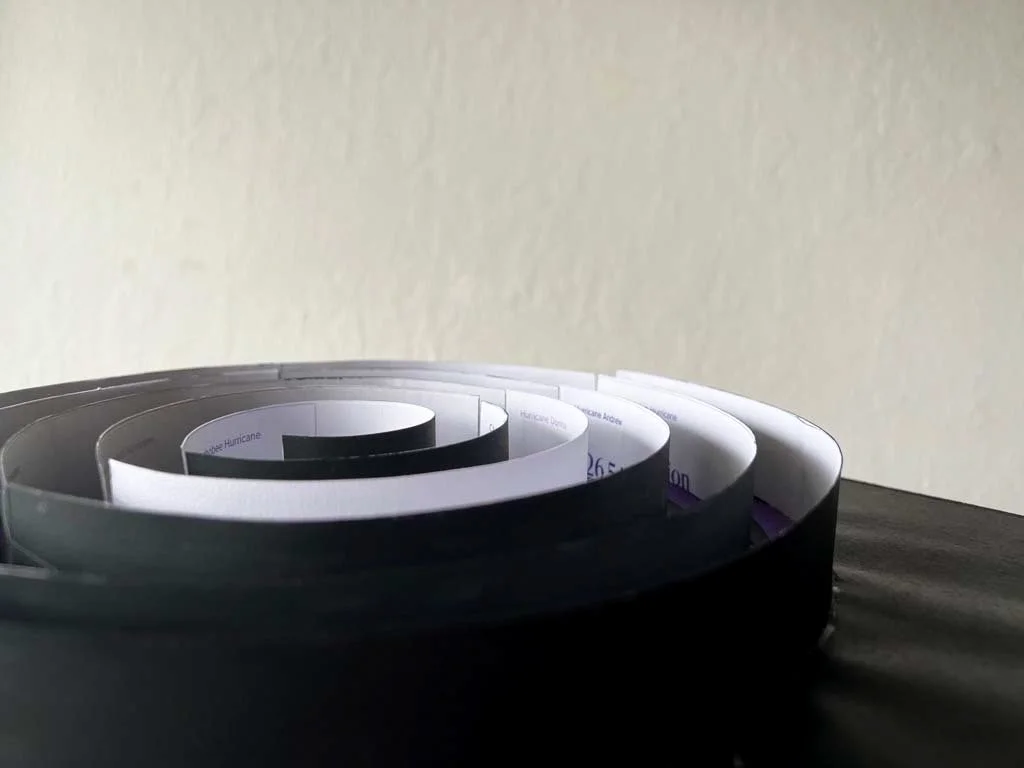
Each color tint represents the intensity of the category. Also seen, in the 2d infographic.
The spiral starts in the middle and slowly expands reflecting the formation of a hurricane, categorizing the most destructive hurricanes from least costly to most costly.